
Templates
Start with a ready-made Rawlytics Notebook instead of a blank page. Browse examples covering data exploration, statistics, visualization, and common analysis workflows.
Every template is fully editable. Fork it, customize it, and make it your own.
Browse Notebook Templates

Bar Plot: Basic Chart
Create a simple bar chart to compare values across categories.
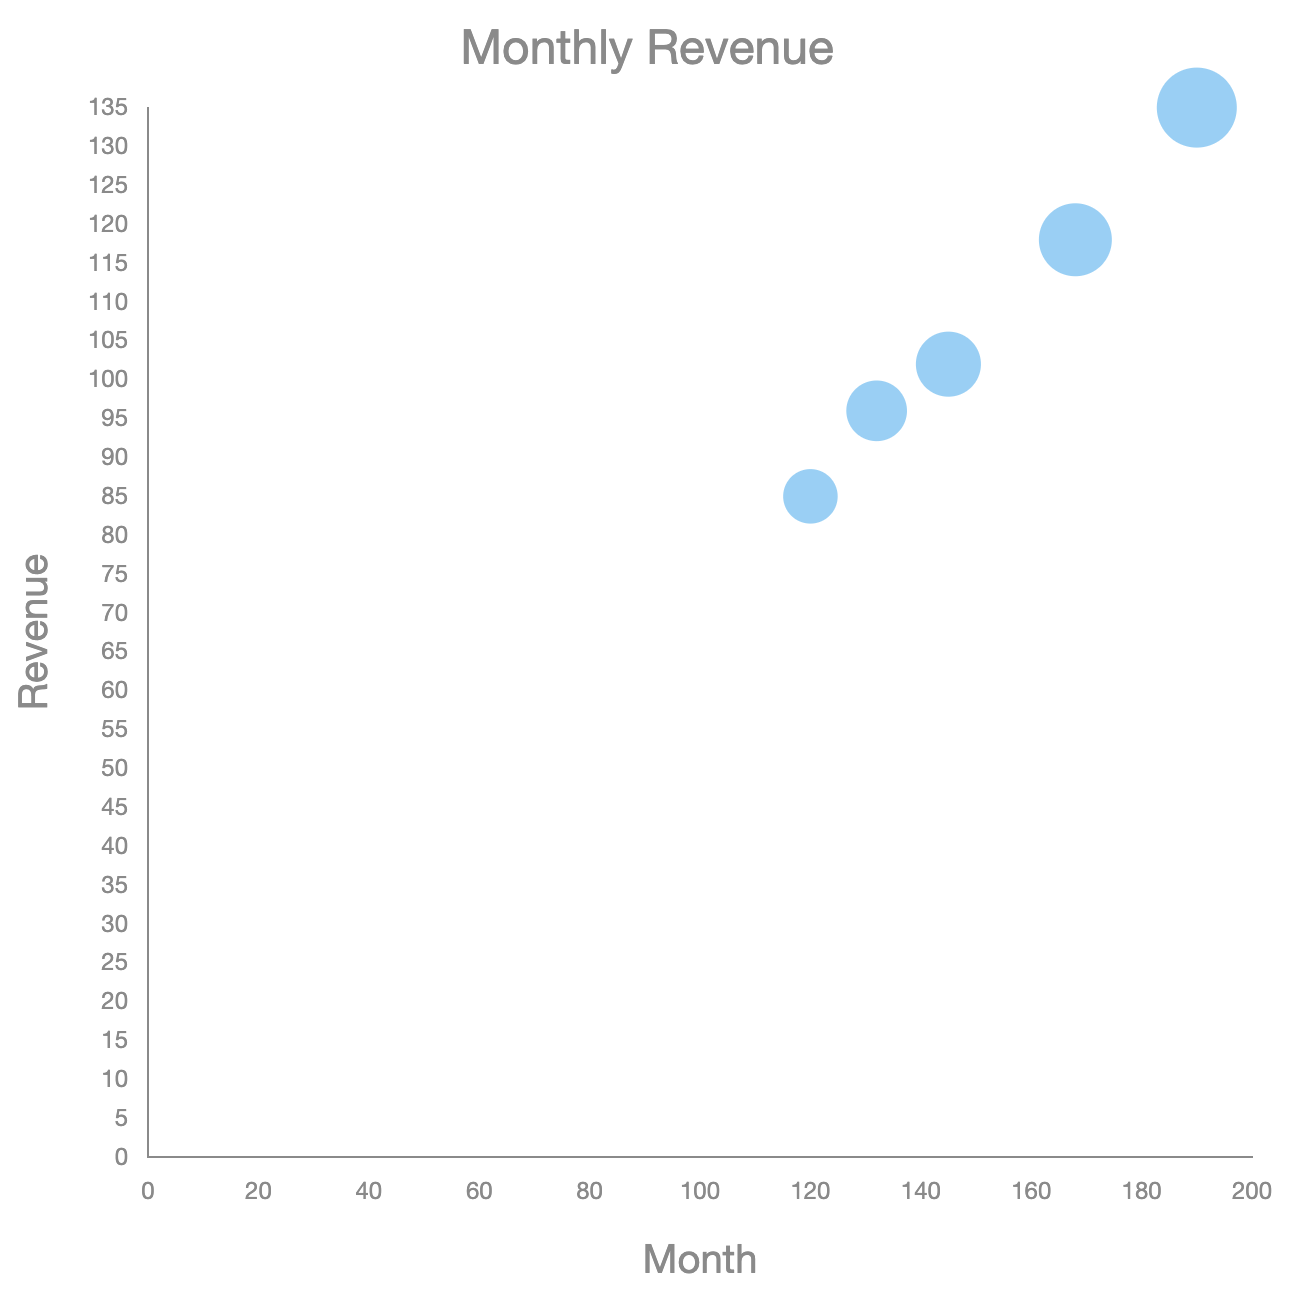
Bubble Plot: Basic Chart
Explore the relationship between two variables while using bubble size to represent a third.
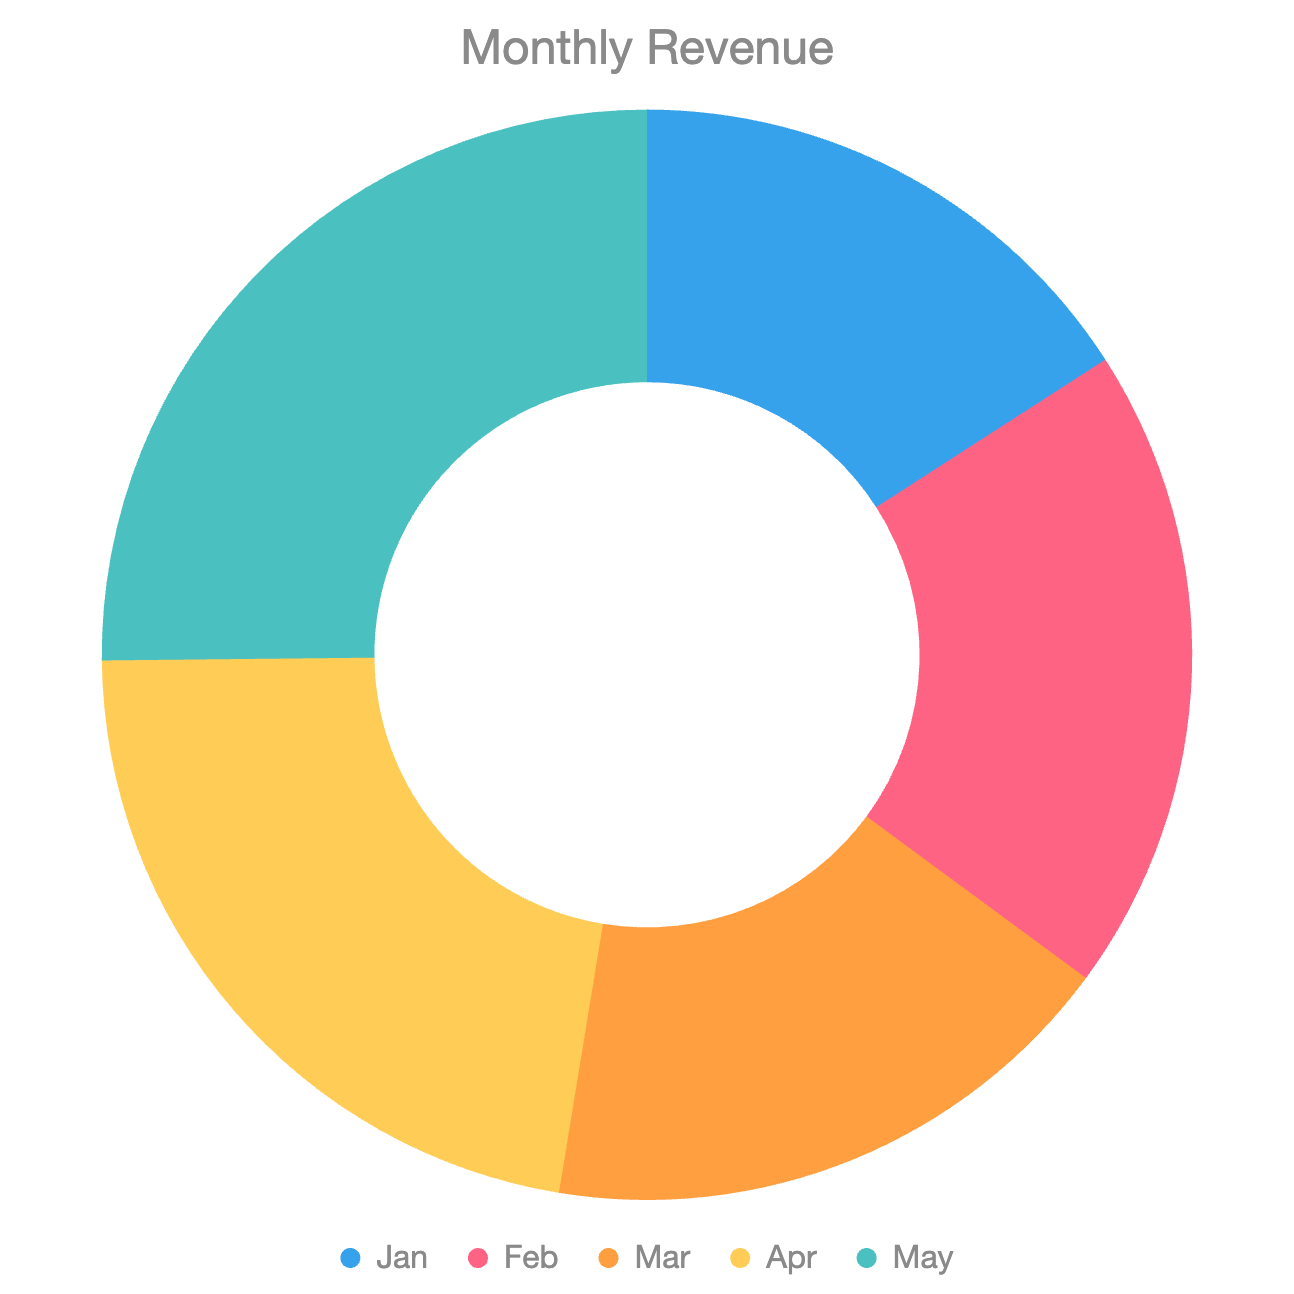
Doughnut Plot: Basic Chart
Create a simple doughnut chart to visualize proportions across categories.
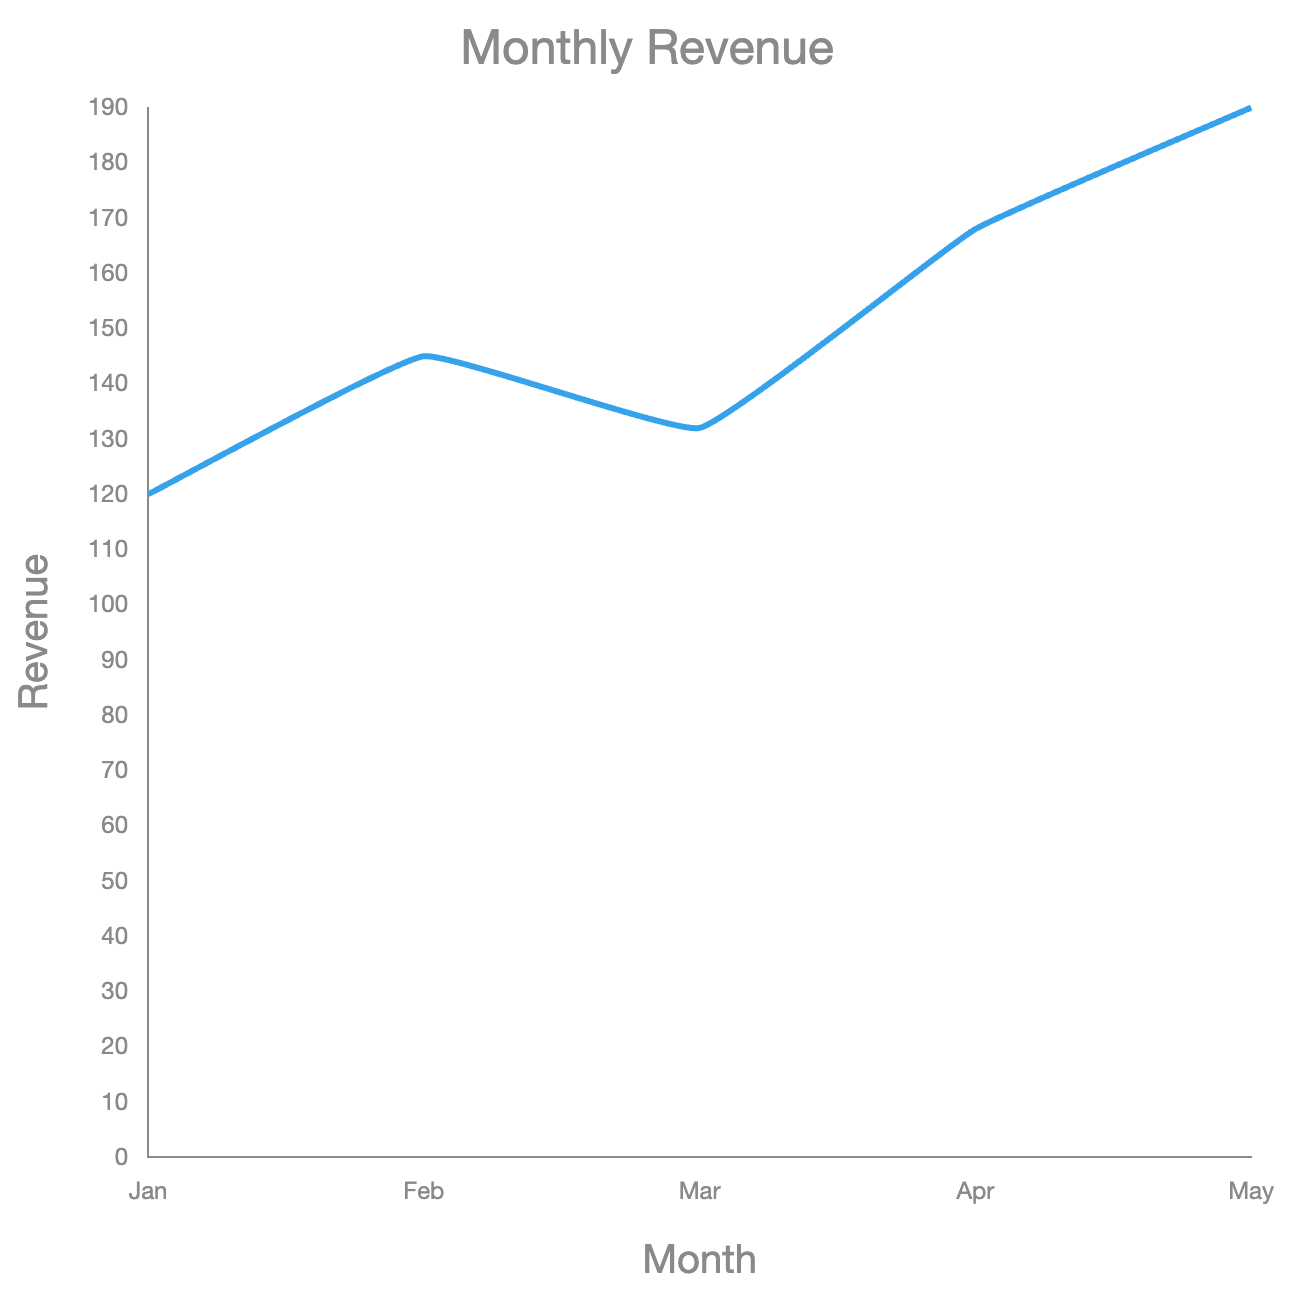
Line Plot: Basic Chart
Create a simple line chart and explore your data over an ordered axis.
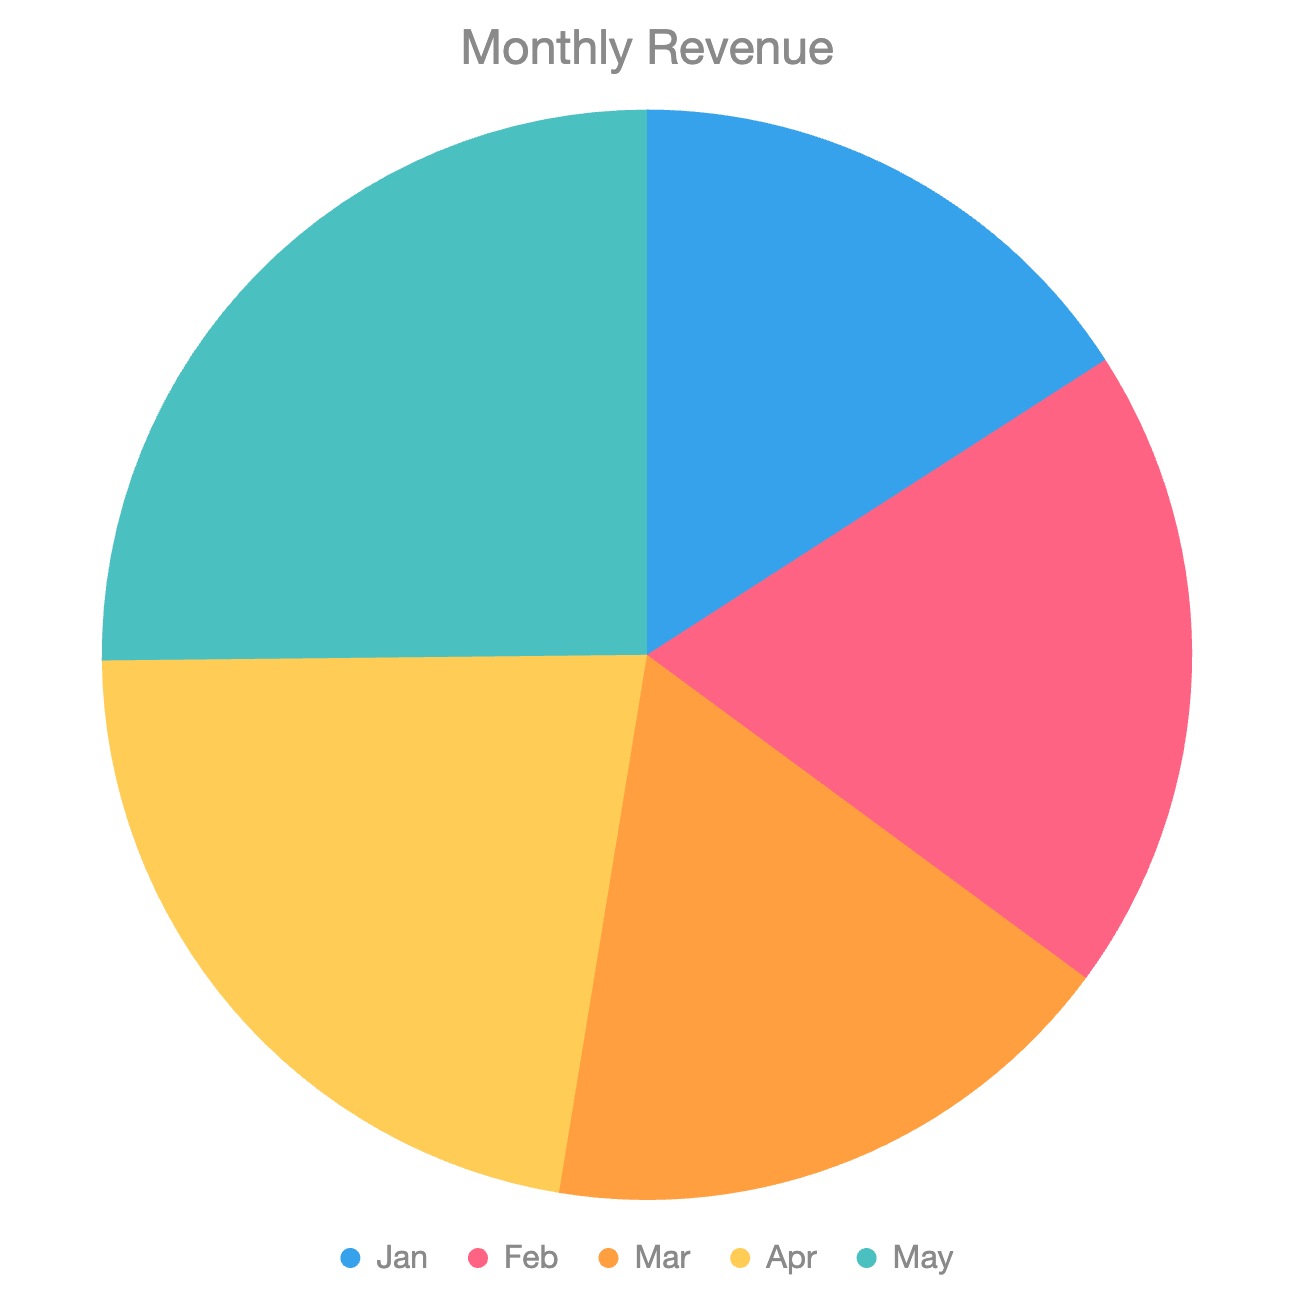
Pie Plot: Basic Chart
Create a simple pie chart to visualize proportions across categories.
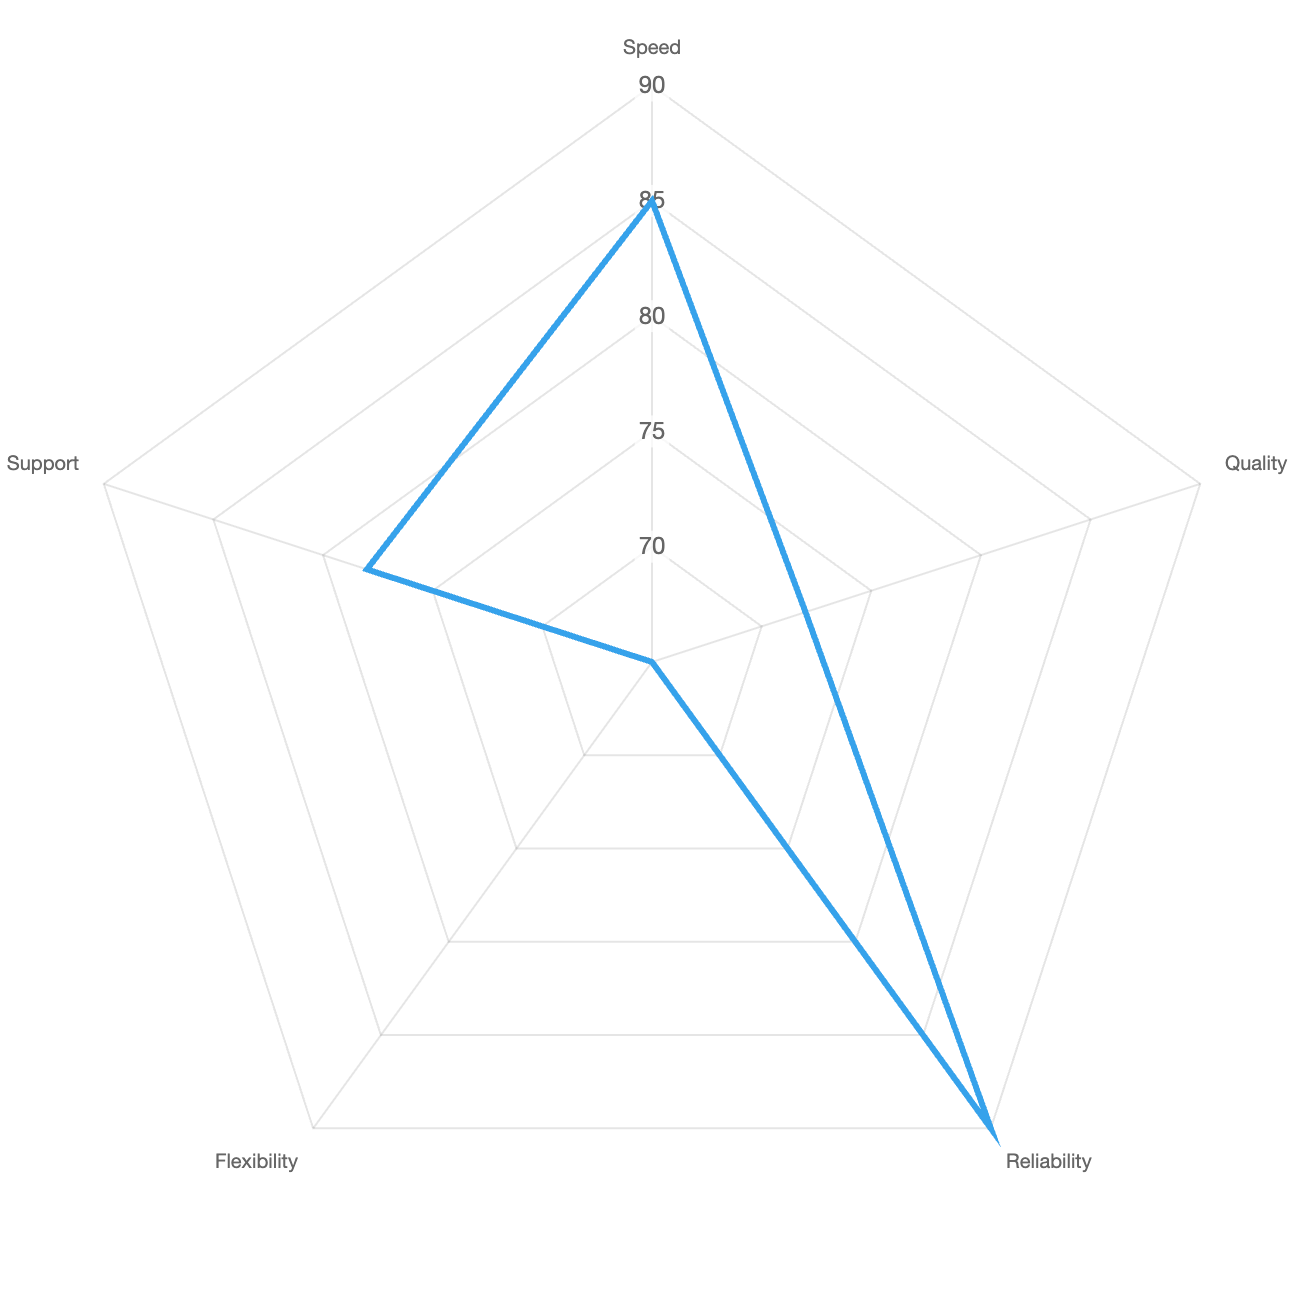
Radar Plot: Basic Chart
Compare multiple values across several categories in a single radar chart.
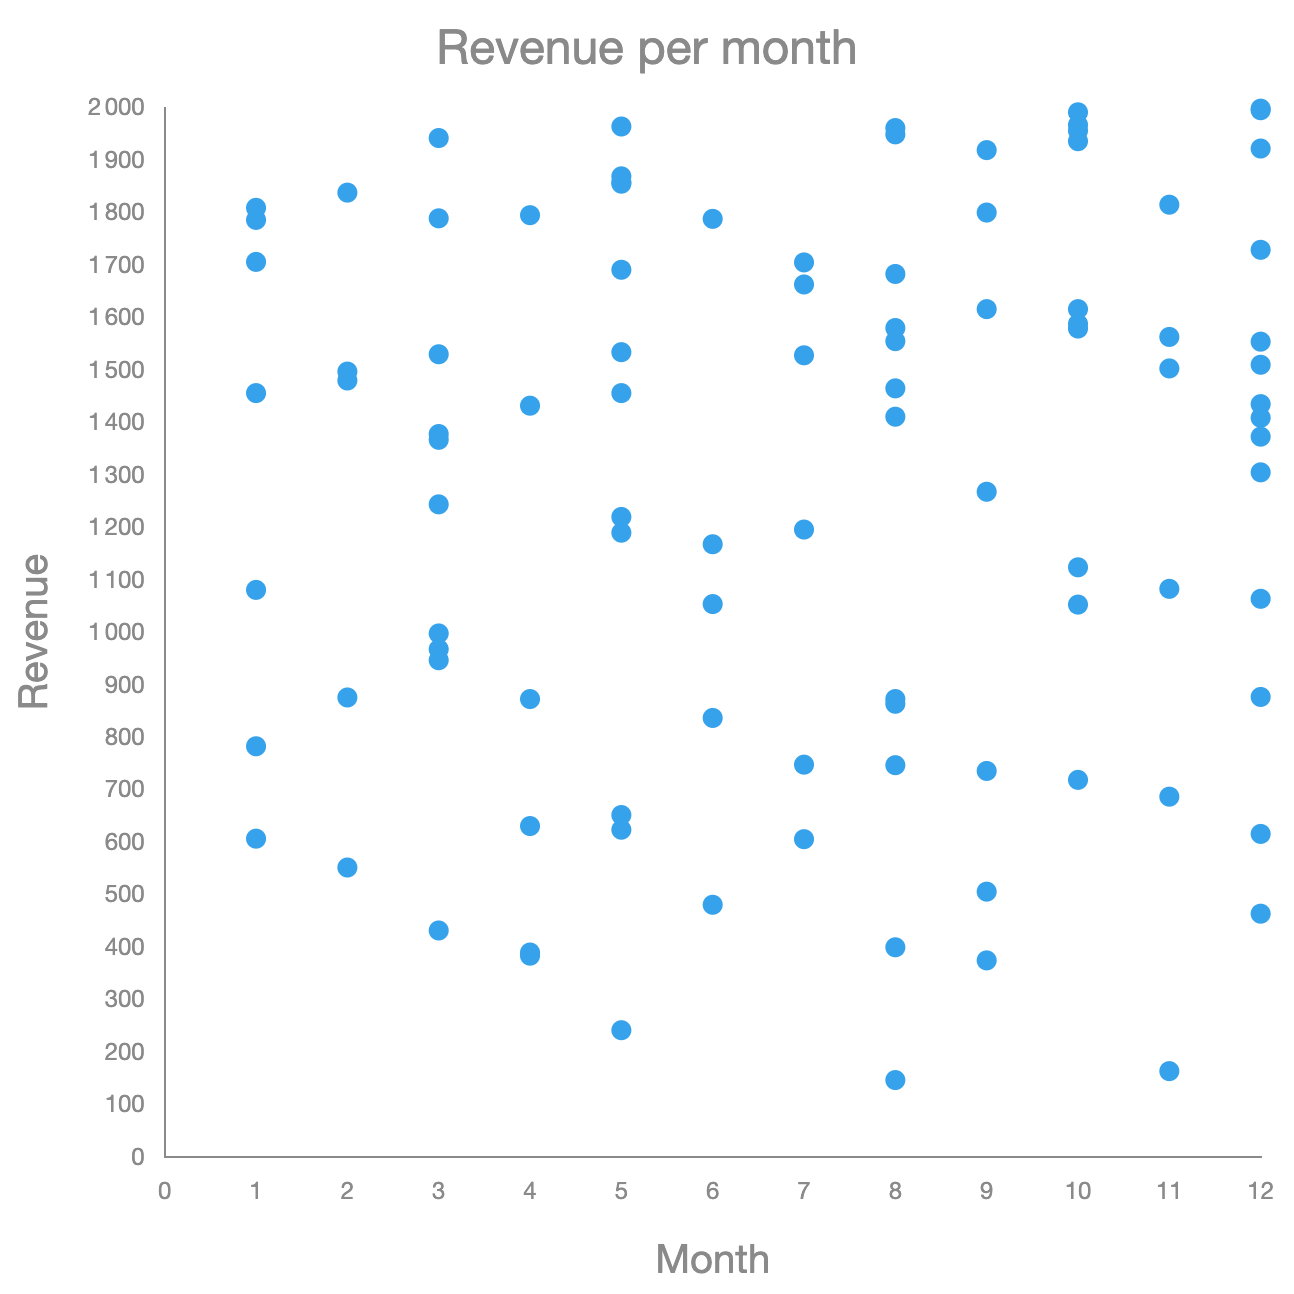
Scatter Plot: Basic Chart
Create a simple scatter plot and explore the relationship between two numerical variables.
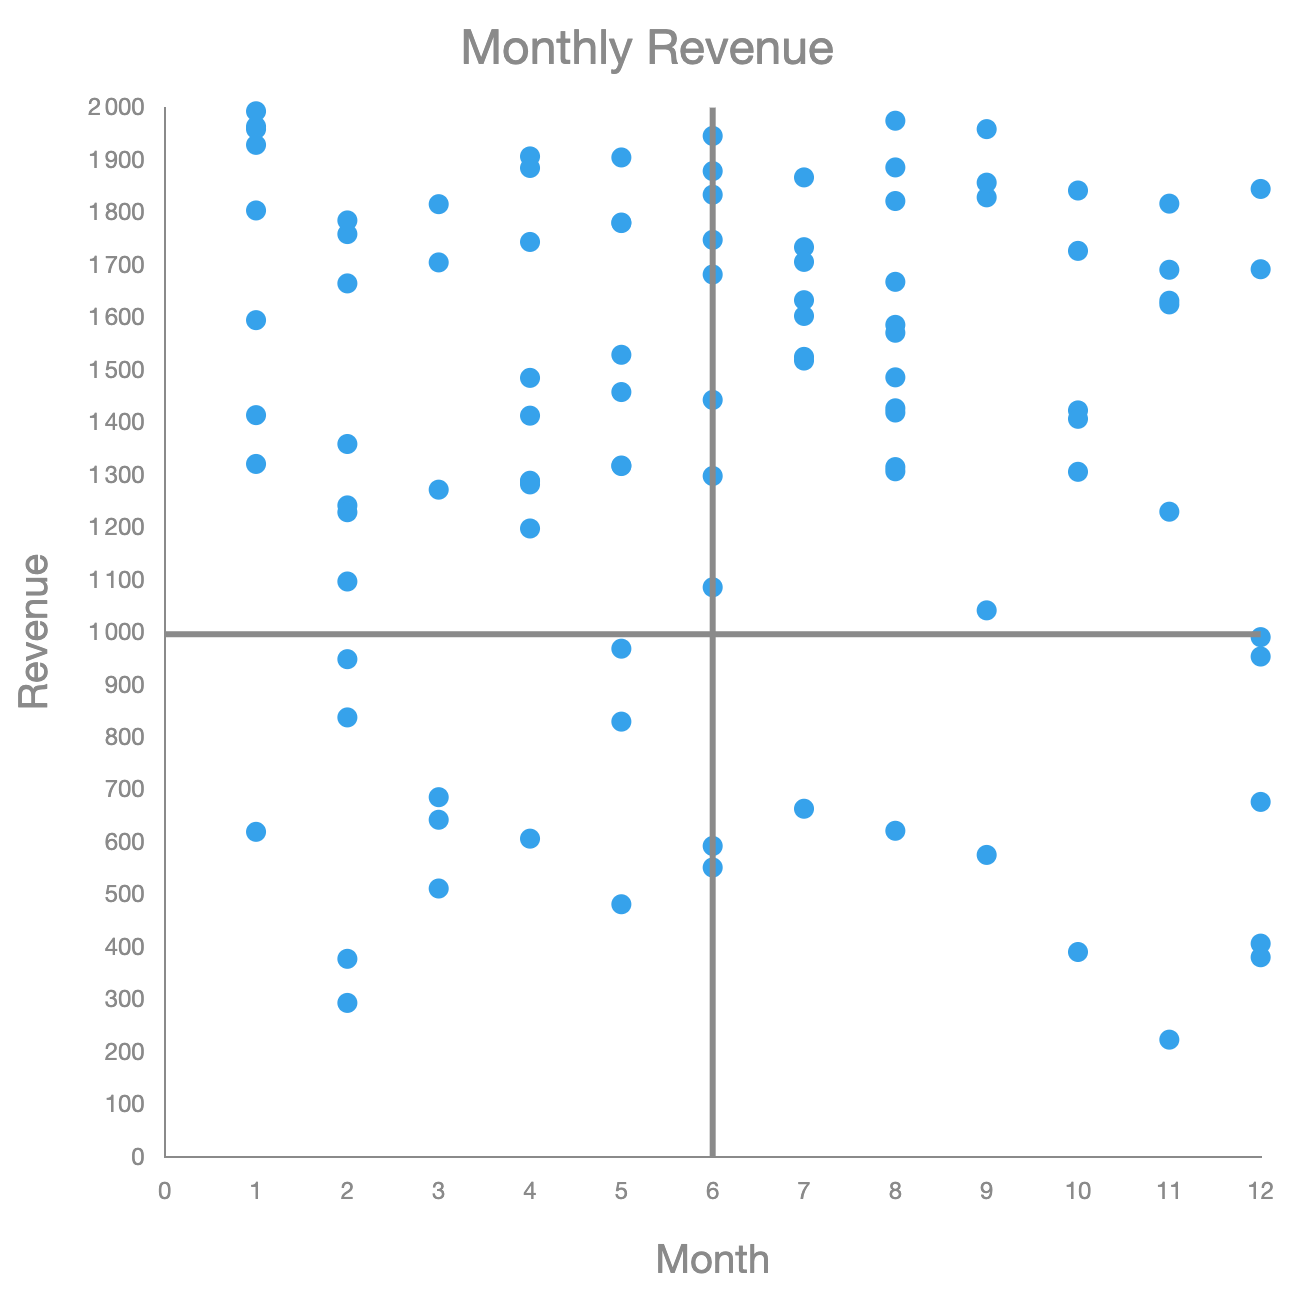
Scatter Plot: Centered Line Marks
Add centered horizontal and vertical marks to divide the scatter plot into four quadrants.
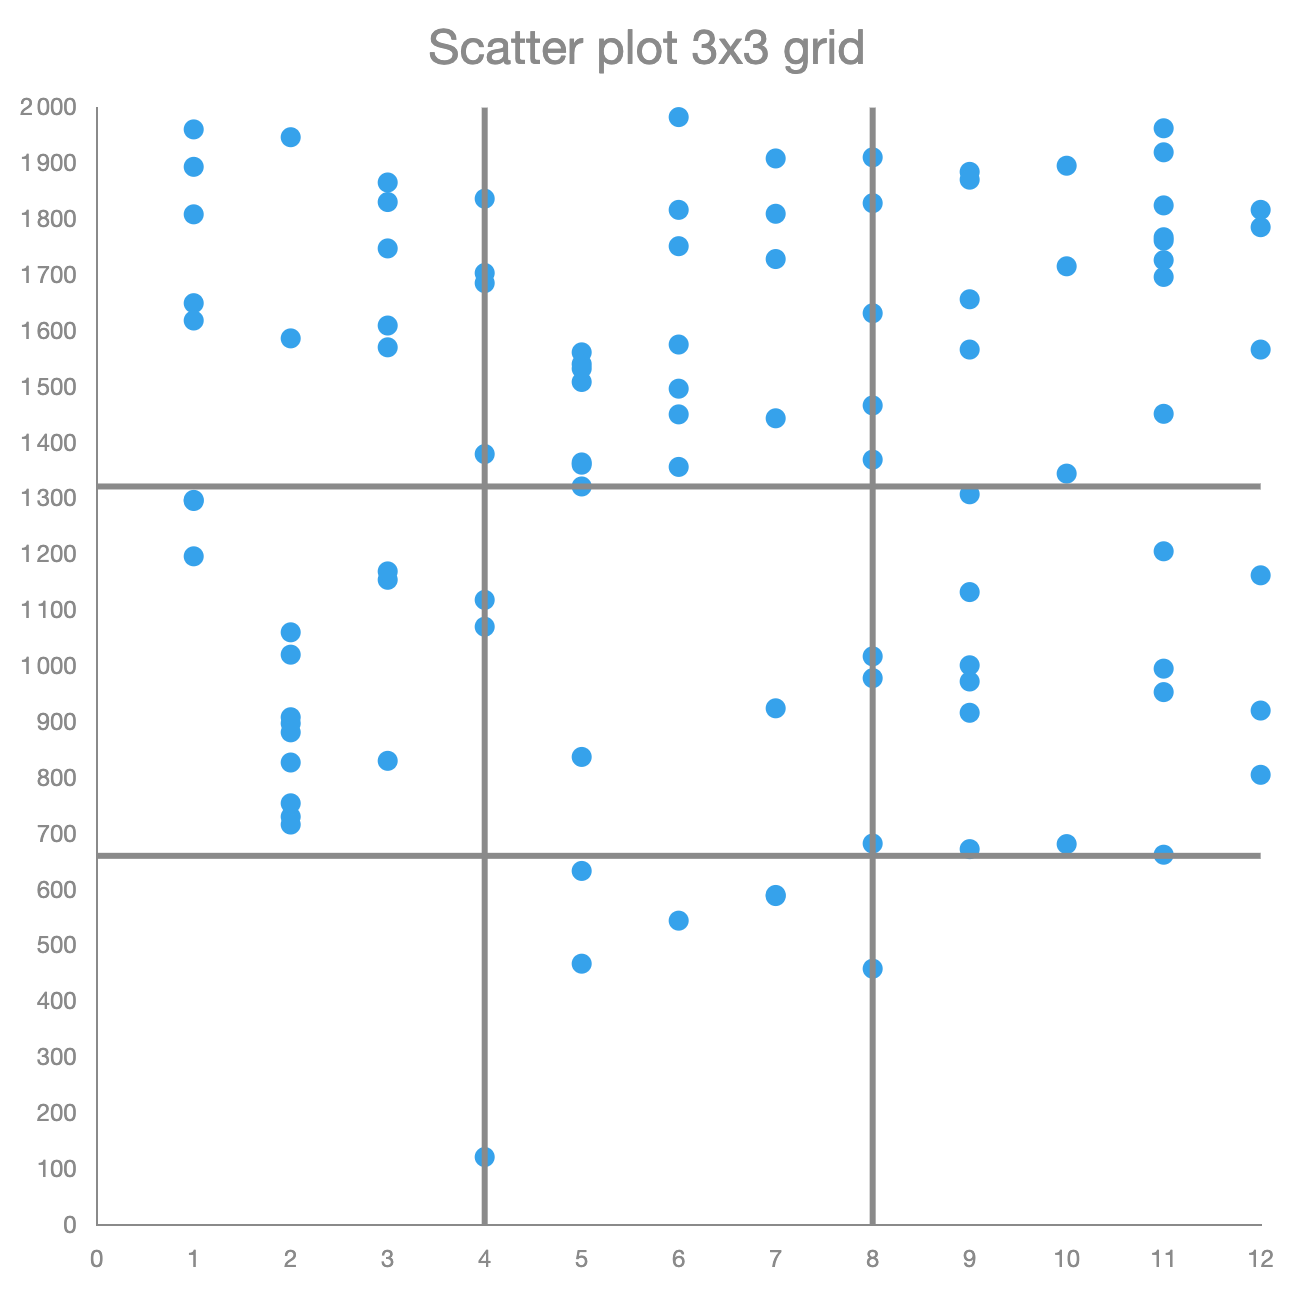
Scatter plot: 3x3 grid
Divide the scatter plot into nine zones using two vertical and two horizontal line marks.

Calculator: A/B Test Significance
Determine whether the difference between your variants is statistically significant.
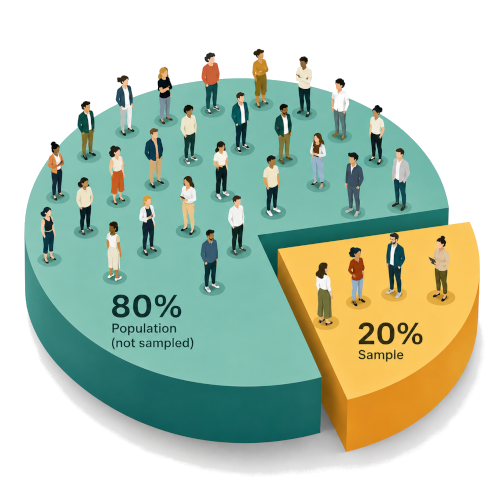
Calculator: Sample Size
Calculate how many observations and duration you need to reliably detect an effect.
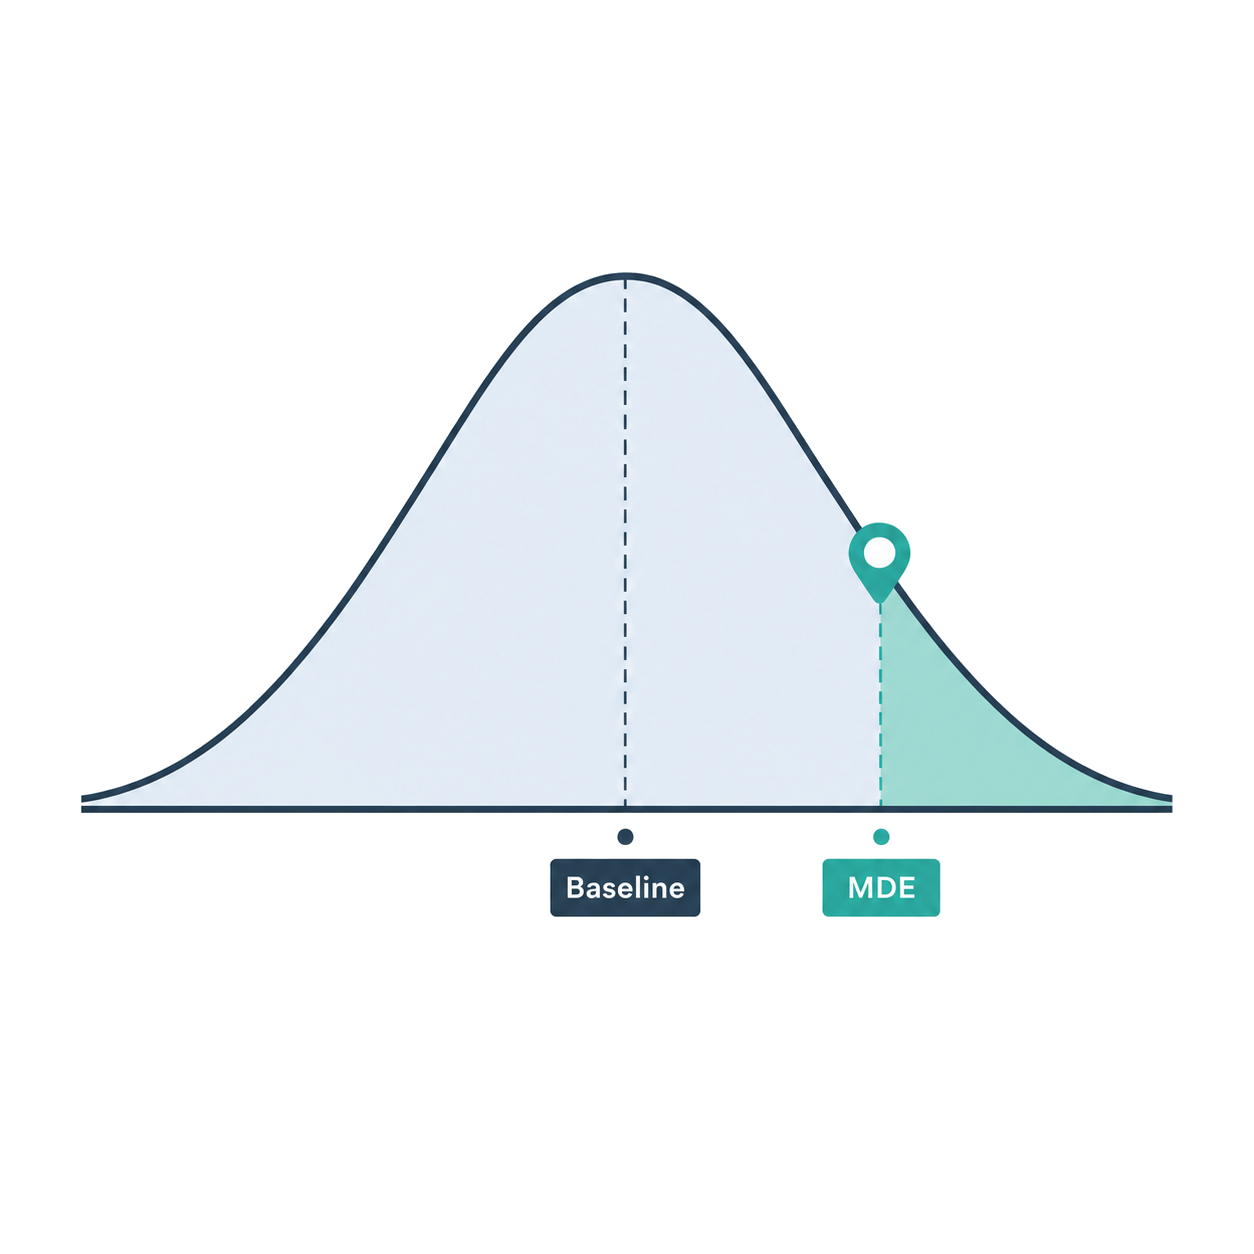
Calculator: Minumimum Detectable Effect
Find the smallest change your experiment can reliably detect.
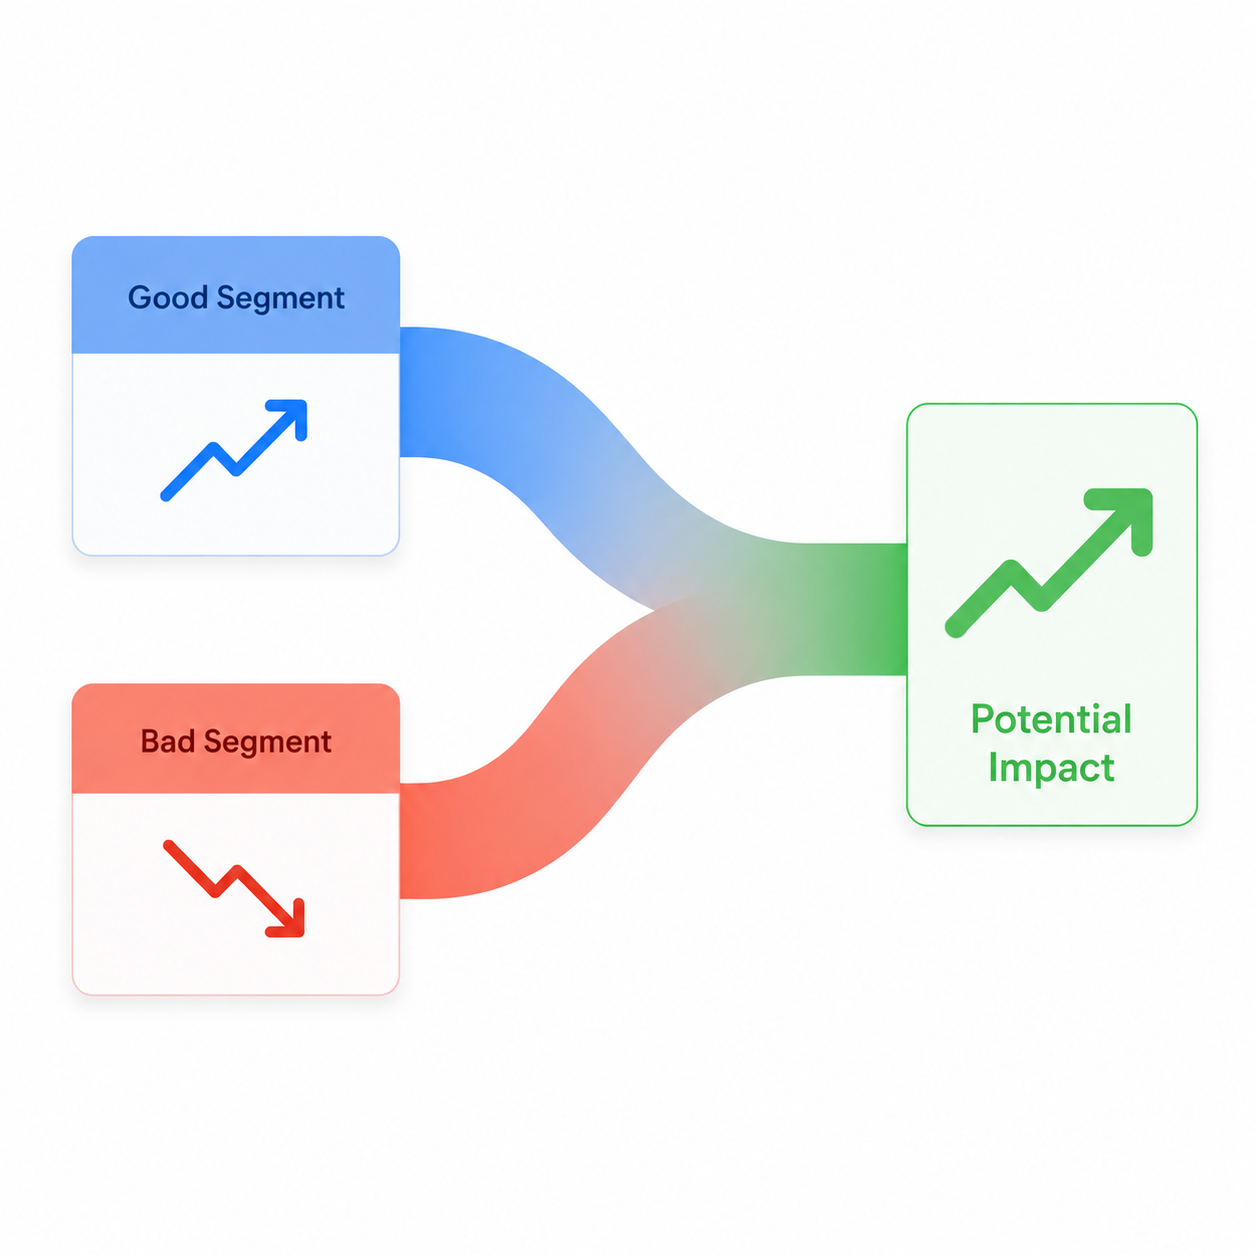
Looking for a Template?
Can't find the template you're looking for?
If you have an idea for a notebook template that could benefit other users, let us know through the Contact page.